Skip to UX framework
Mourad Portfolio Logo
MOURAD VISUALS
  1. Discover & Study

    Research – Empathy Map – Persona

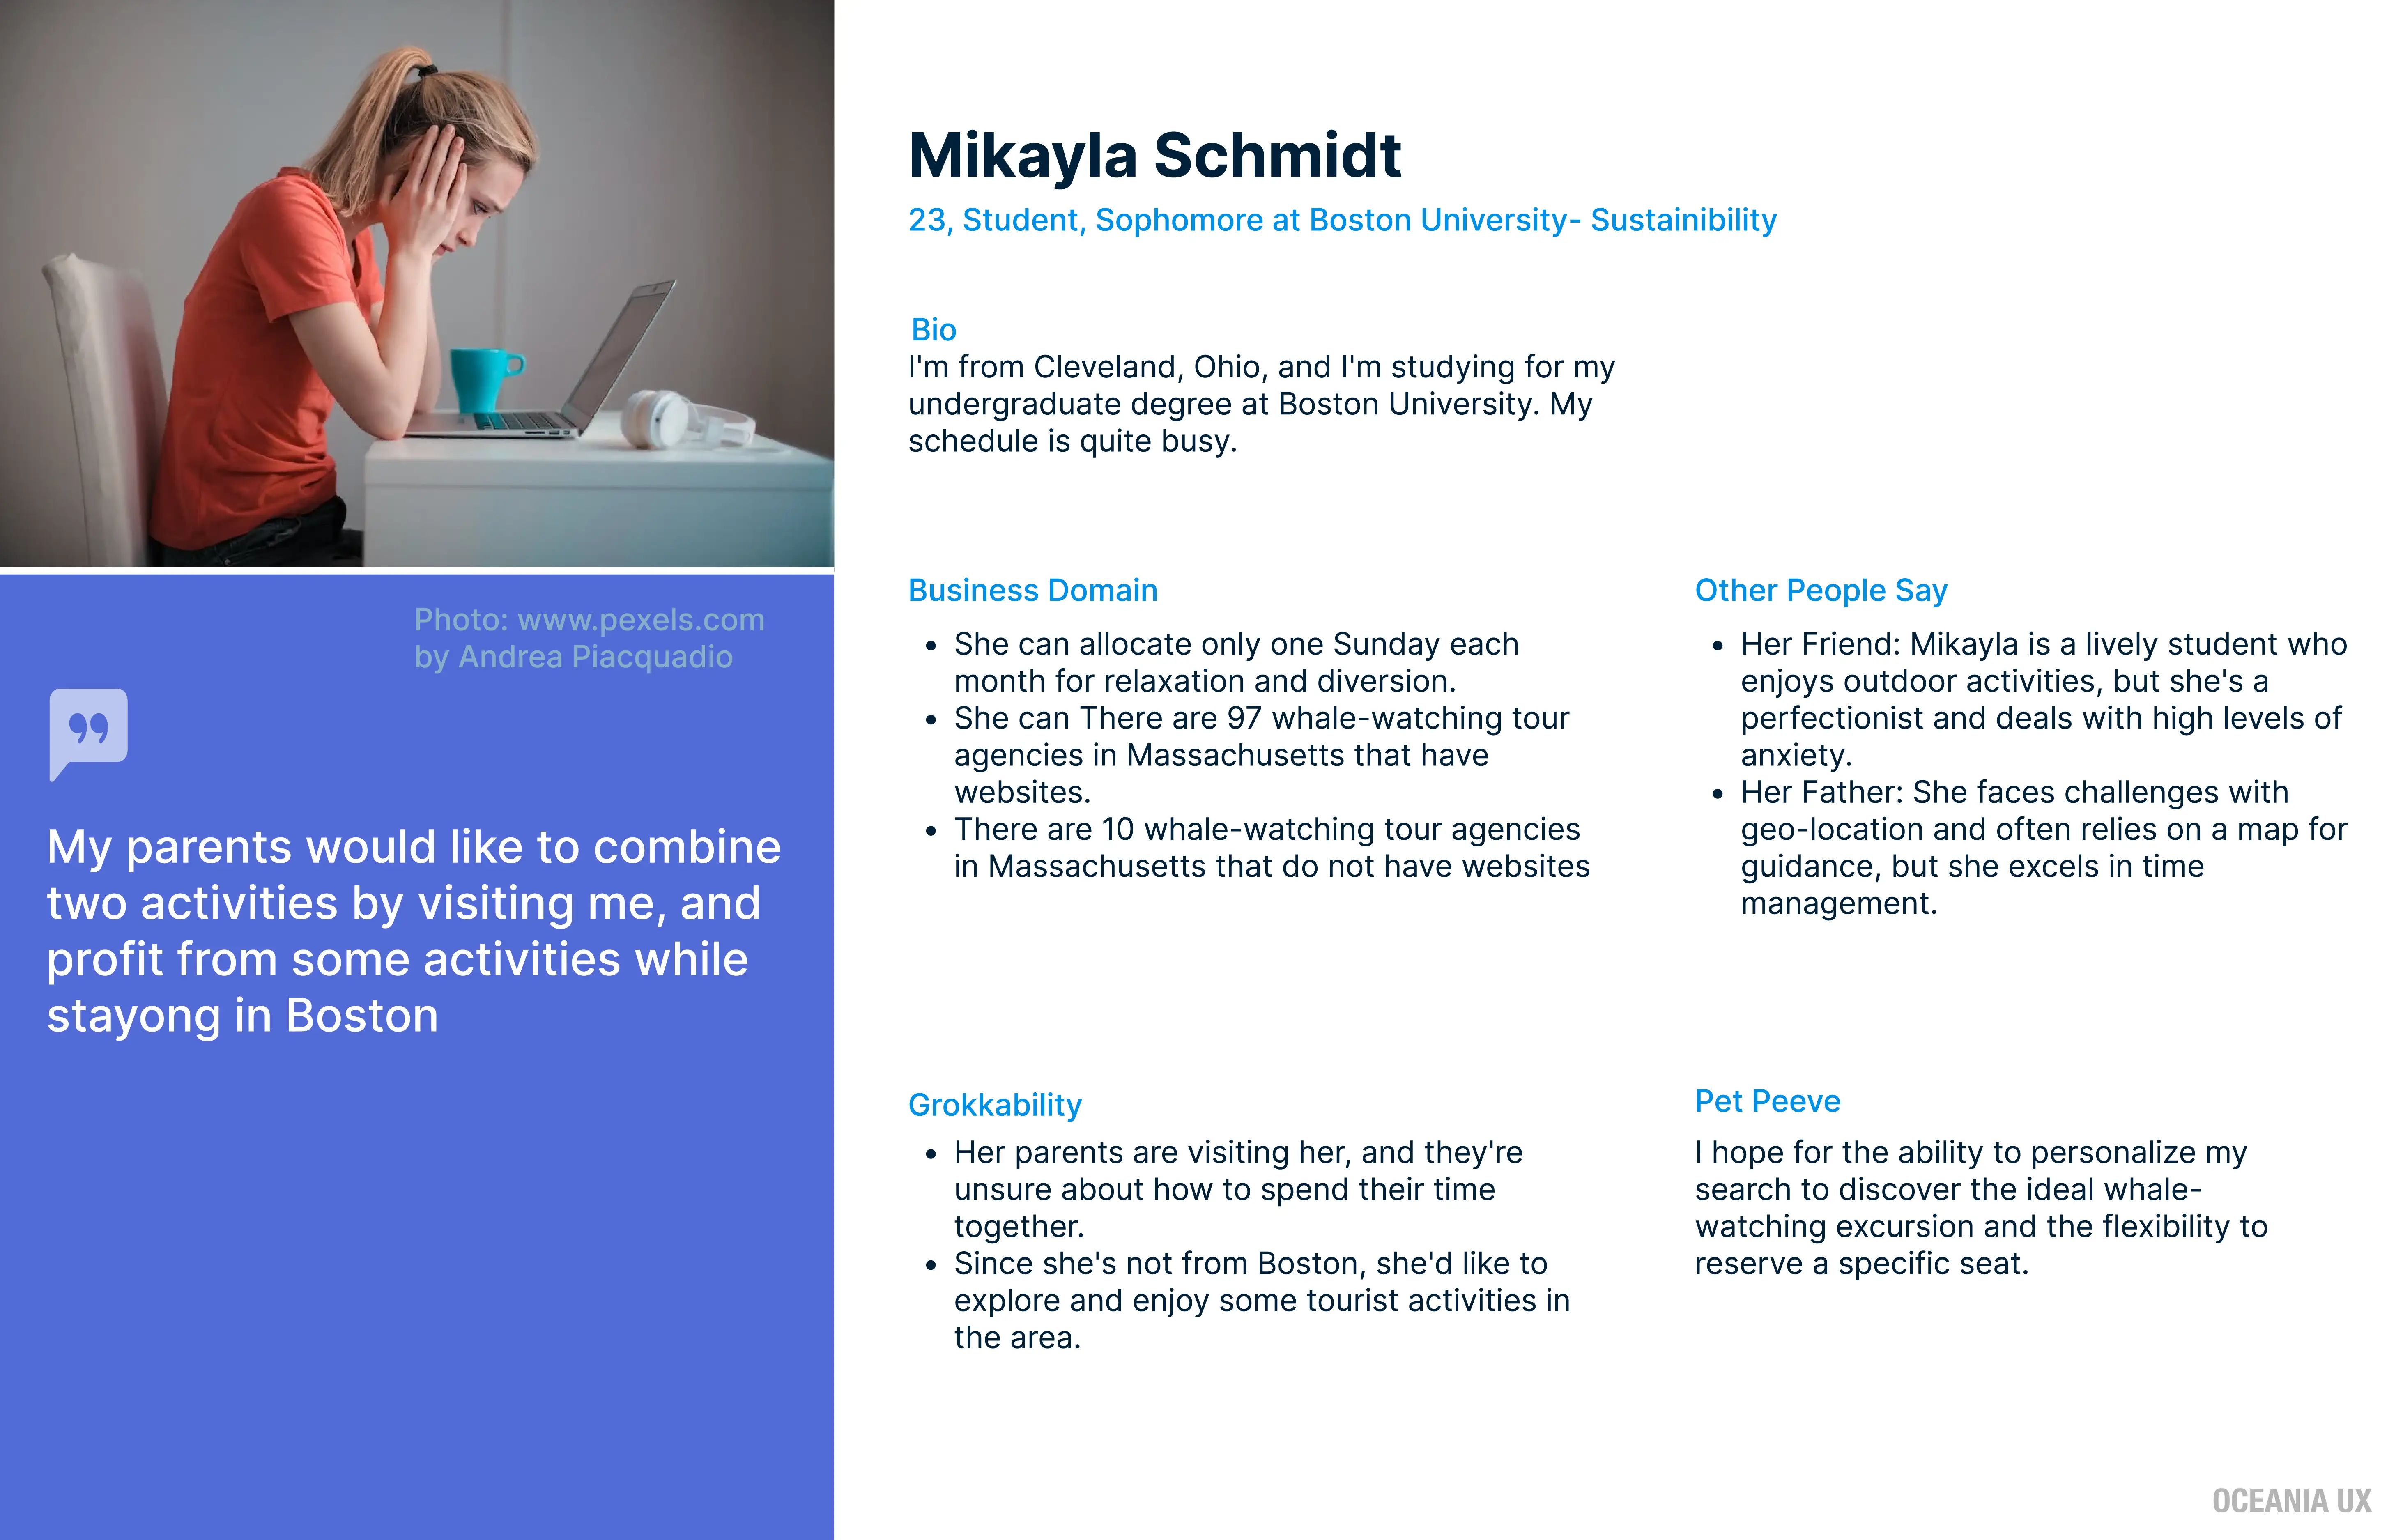
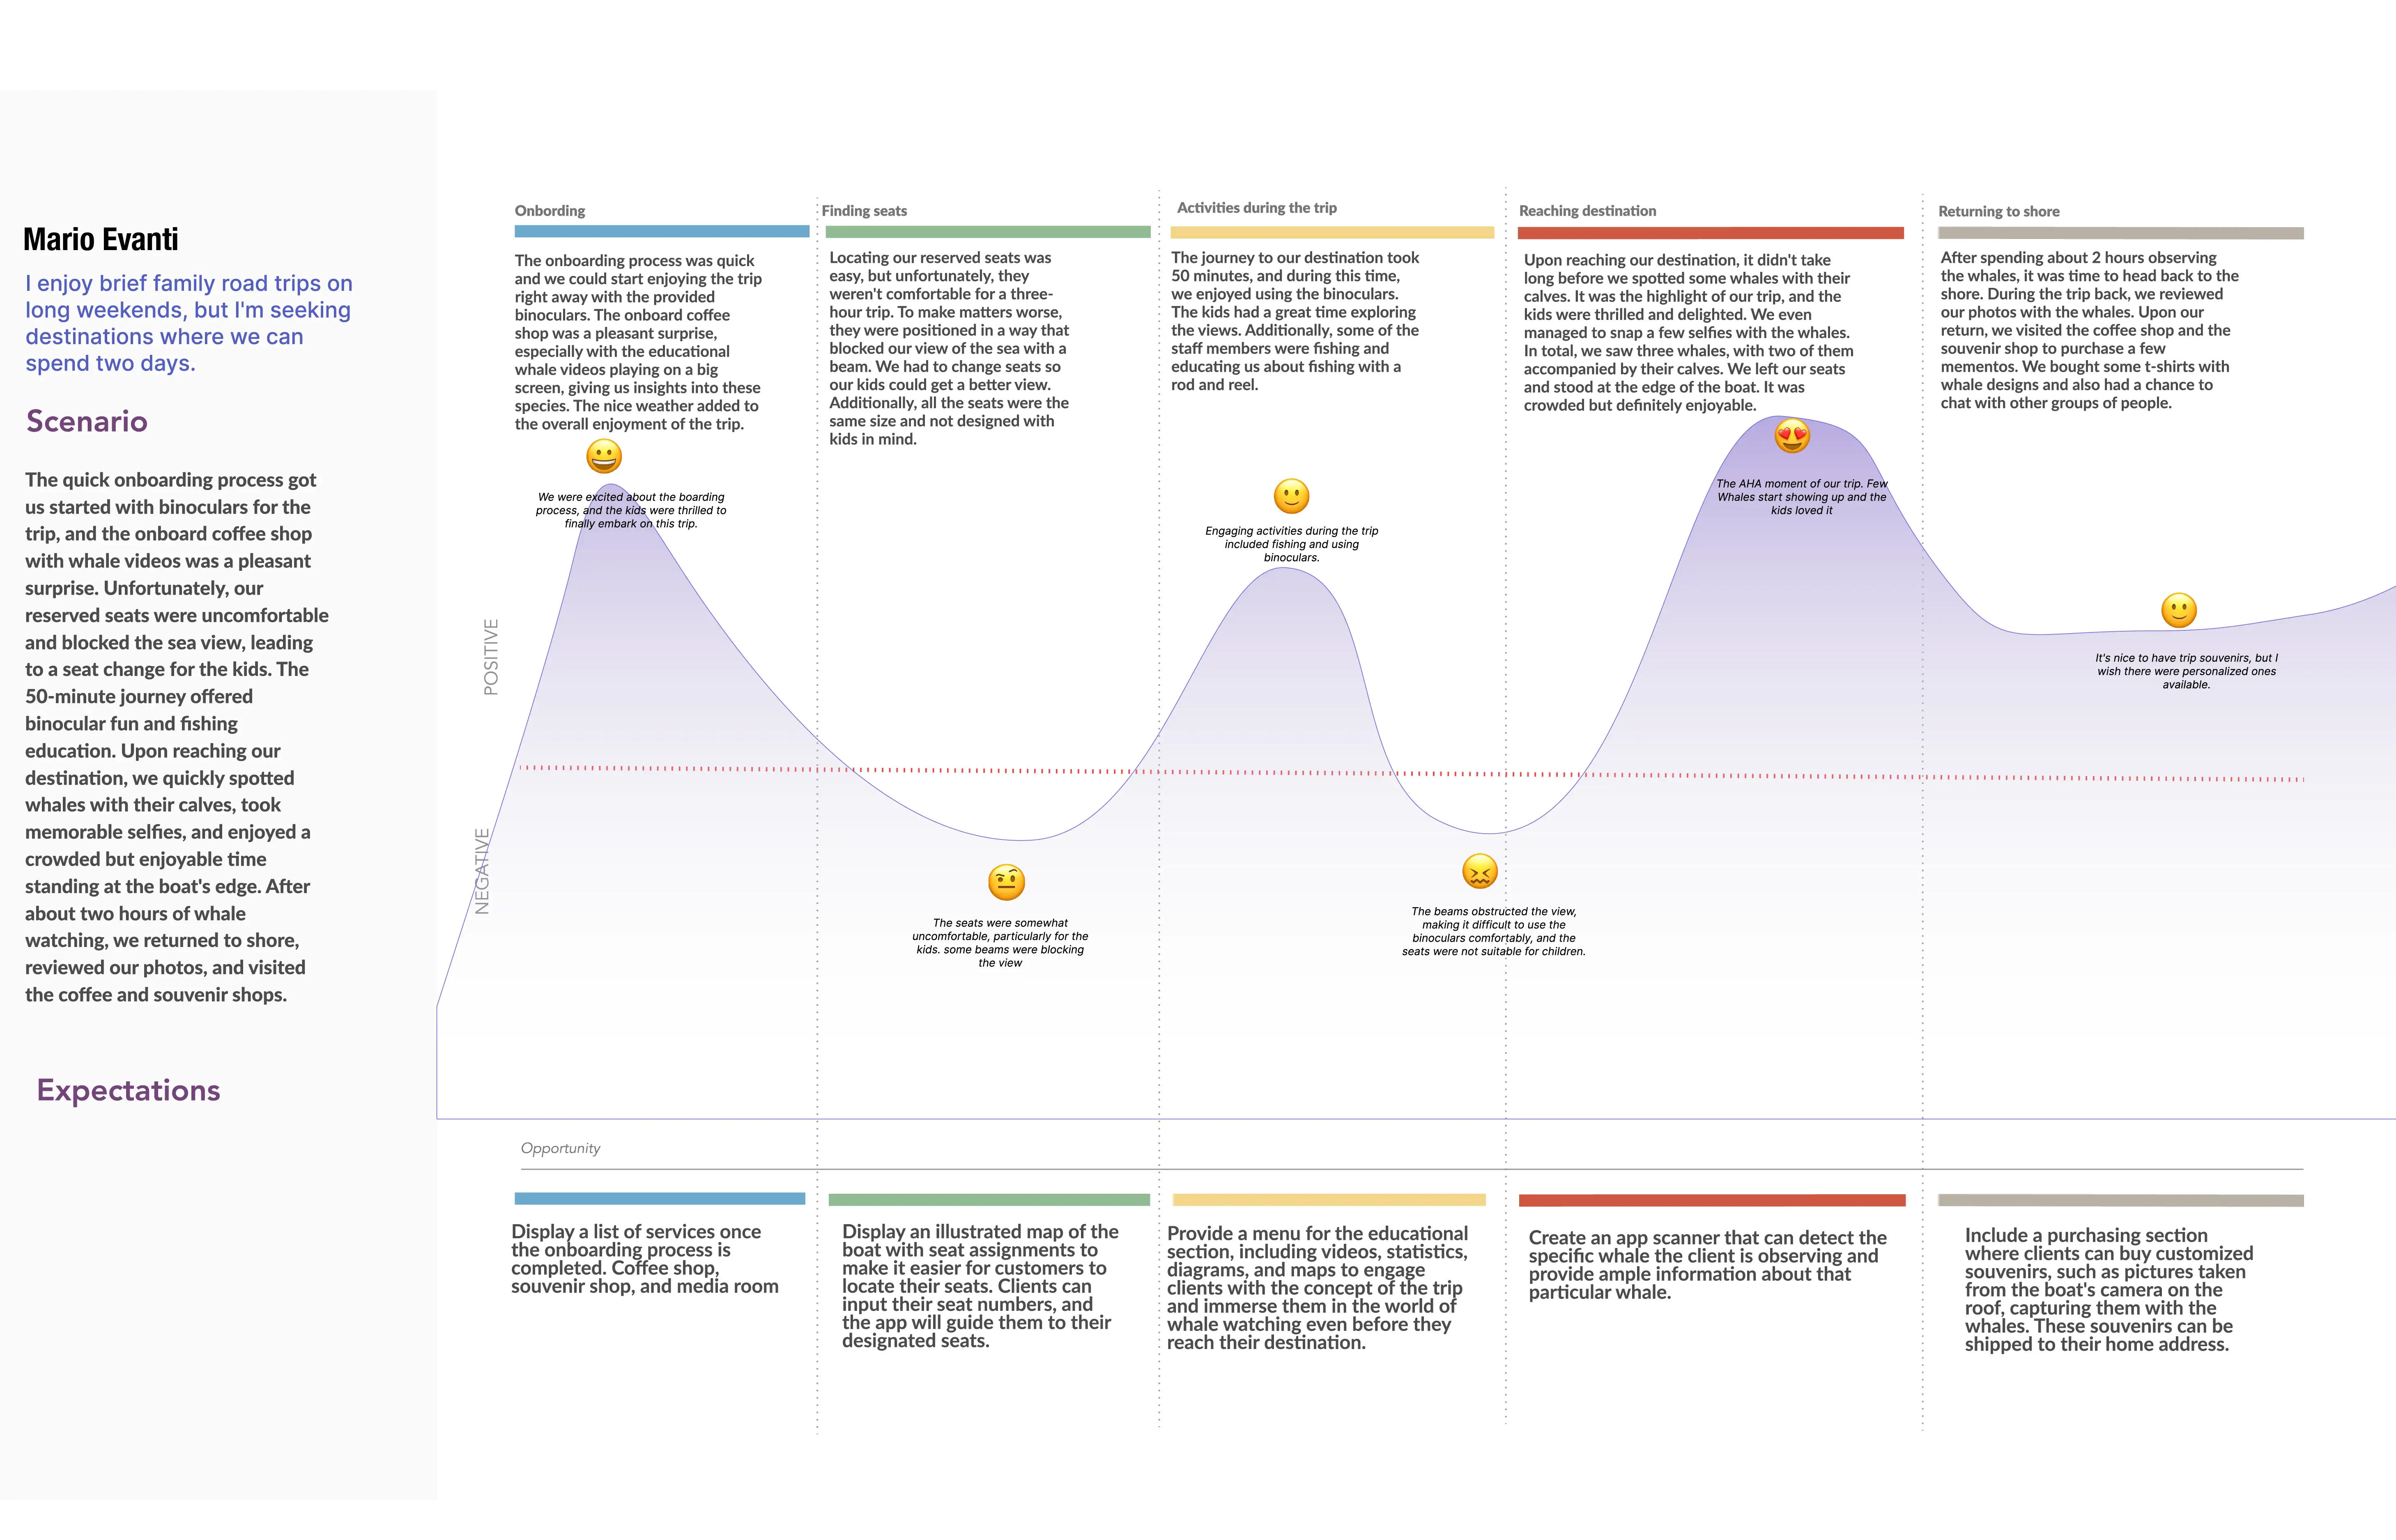
    Understand user needs through research, map emotions and pain points, and create realistic user personas to guide design decisions.

  2. Define & Ideate

    User Journey Map – Brainstorming – User Task – User Flow

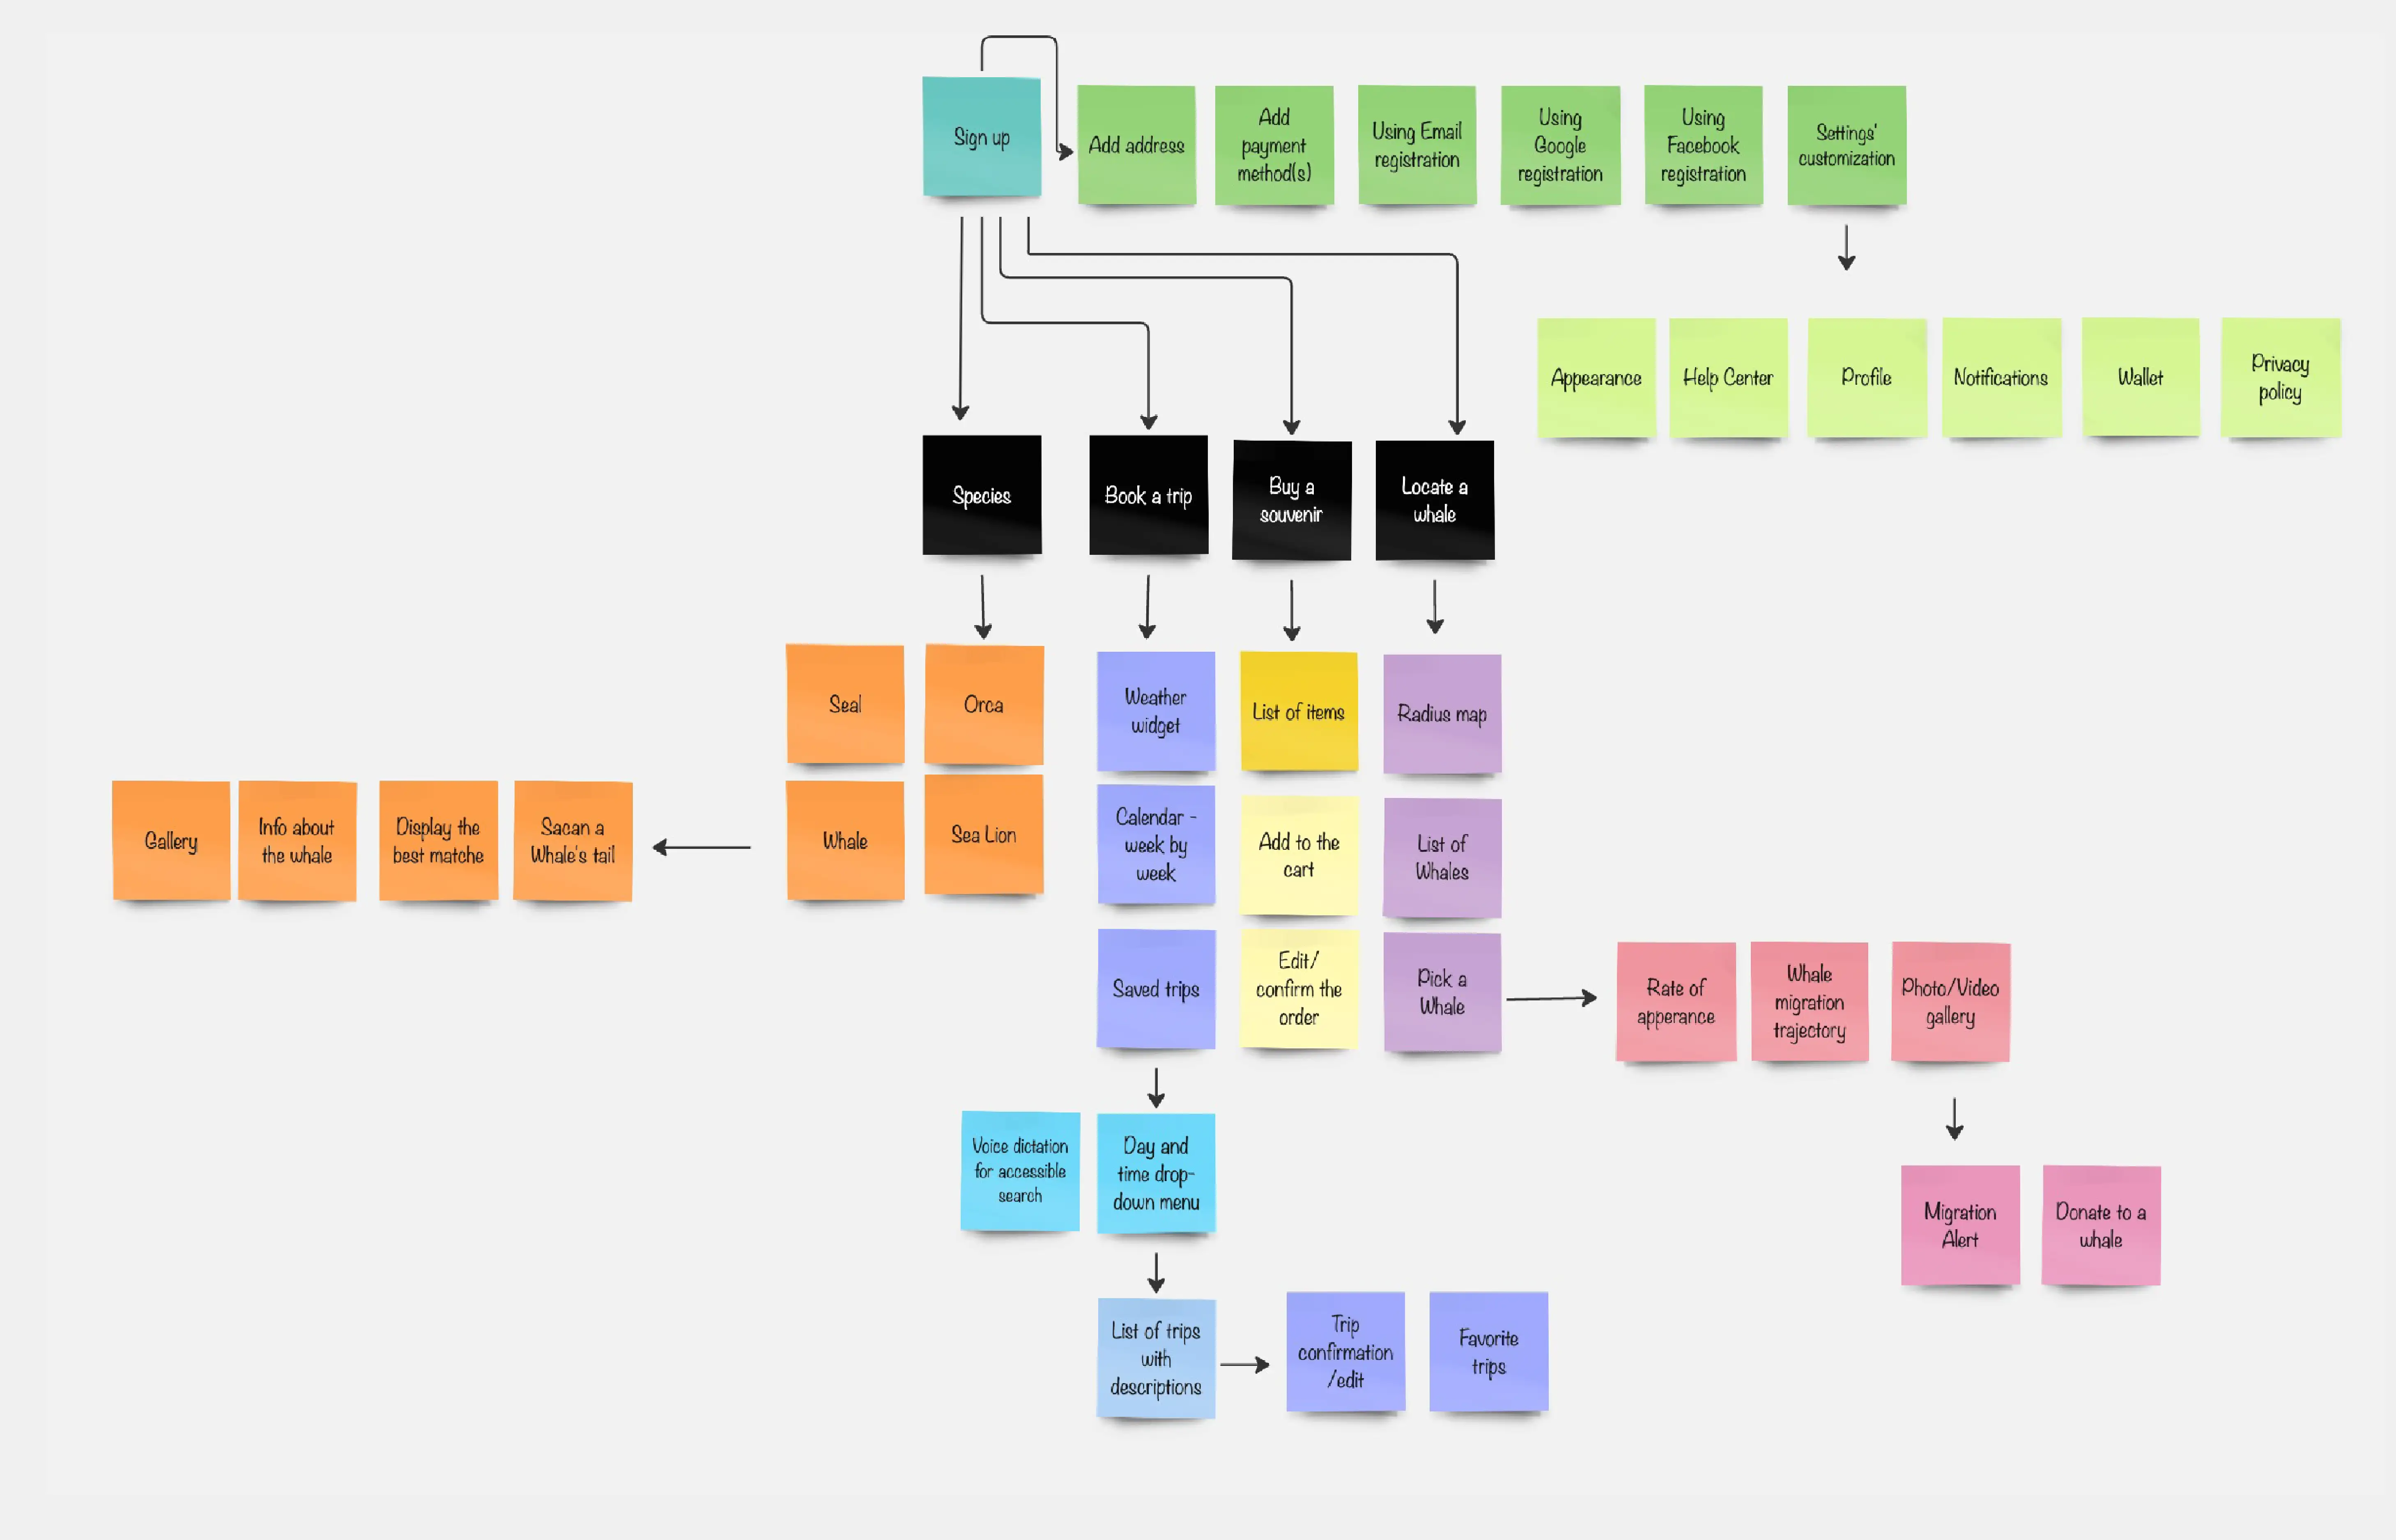
    Analyze the full user experience, generate solution ideas, and outline both linear and non-linear paths users follow to reach their goals.

  3. Design & Test

    Wireframes – Prototypes – Testing

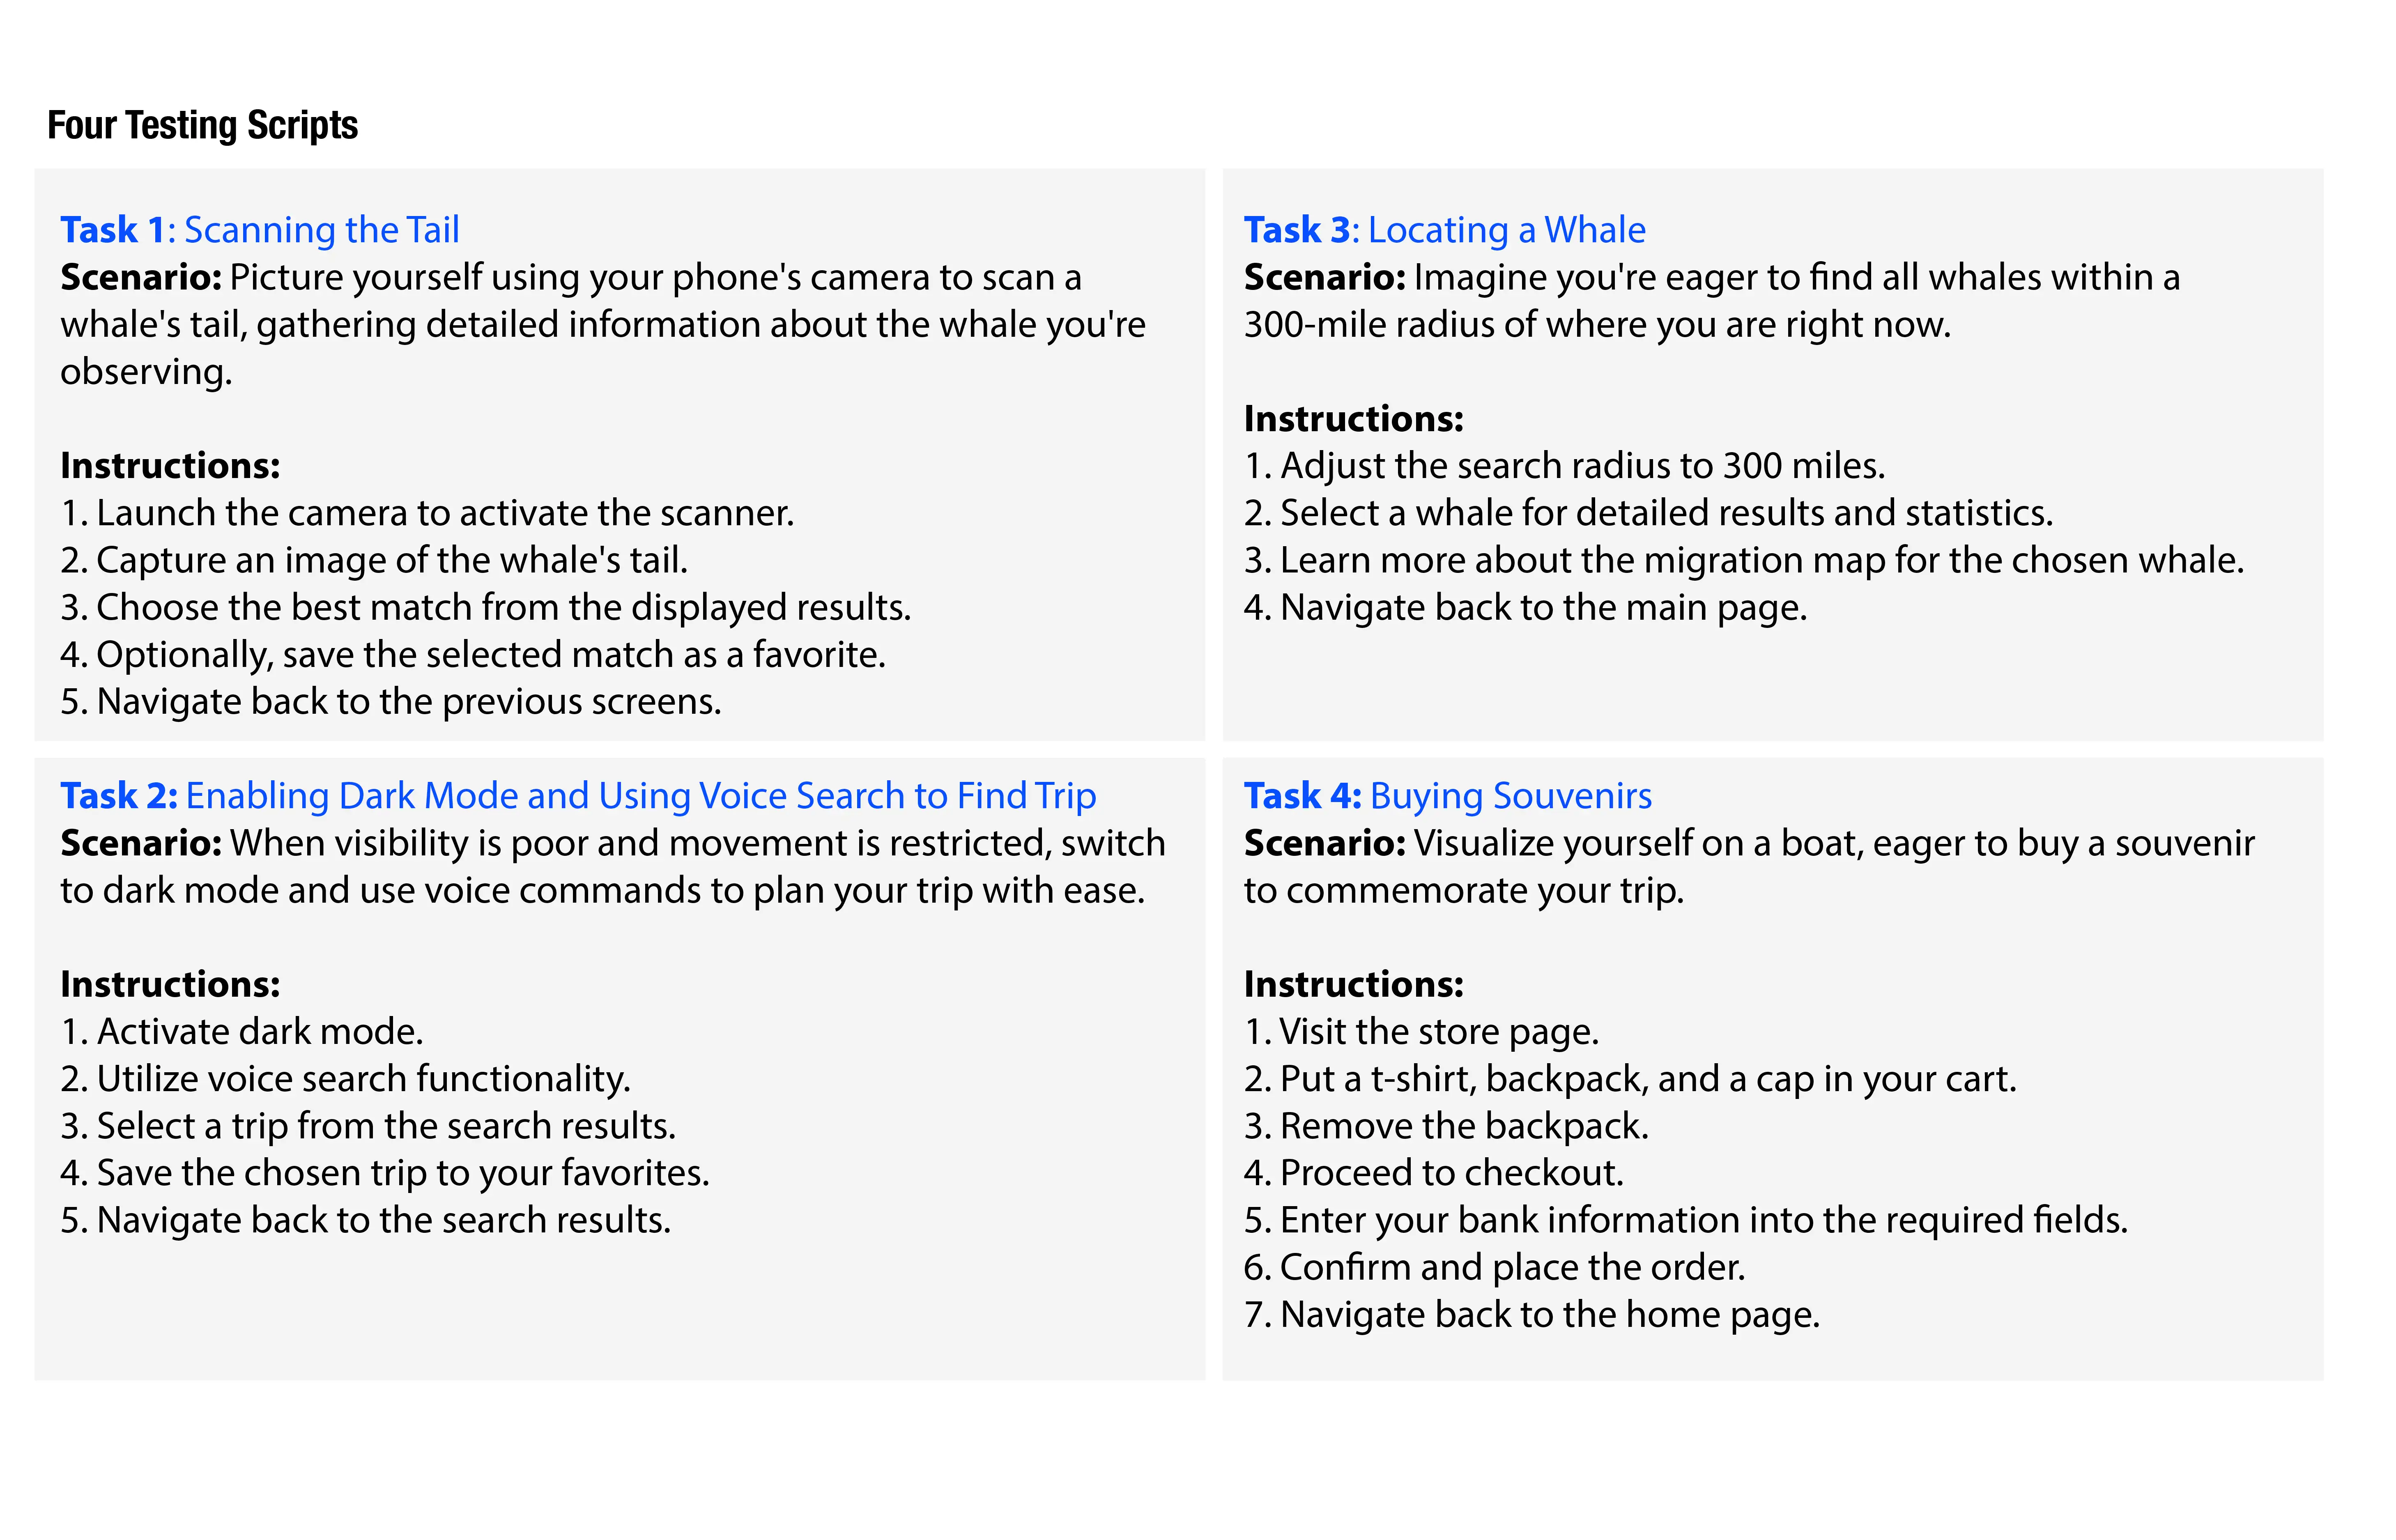
    Translate concepts into tangible designs and validate them through user testing, surveys, and feedback.

CASE STUDY

OCEANIA APP

Booking A Trip

In this case study, the prototype demonstrates an example of a user journey: booking a trip in the app using light mode. The journey simulates a real-world scenario where the user—or member—interacts with various features to explore booking options. The goal is to make the experience intuitive and effortless, while always giving the user the option to switch to dark mode.

Screenshot 1 of 13: Prototype 1 - Oceania-Prototype-Data interface showing UI elements
Skip to data sources
Prototype 1 - UI elements

Tracking A Whale

In this example, the app guides the user to one of its four main features: “Scan a Whale.” By taking a photo of the whale's tail—used as a unique identifier—the user can later track the whale with minimal effort. The experience is designed to be fast, engaging, and fun, mirroring the excitement of the boat trip without distracting from it. The app defaults to dark mode, as scanning with the camera in bright sunlight requires high contrast, making dark mode the optimal choice for a user-friendly experience

Key Website Insights

8s

Average time to decide to stay

*1
60%

Mobile traffic in 2024

*2
41%

Users with accessibility needs

*3

Analytics Charts

Six analytics charts showing user attention span, device usage, accessibility metrics, conversion rates, task completion, and engagement patterns.

User Attention Span in seconds

User attention span data: 0-8s: 55%, 8-15s: 35%, 15-30s: 25%, 30s+: 15%. 55% of users stay beyond 8 seconds, 15% are committed users.
55%
Stay Beyond 8s
15%
Committed Users
User Attention Span Distribution

Attention Span Summary

  • 0-8s: 55% of users
  • 8-15s: 35% of users
  • 15-30s: 25% of users
  • 30s+: 15% of users

Device Usage Statistics

60%
Mobile User
32%
Desktop Users
8%
Tablet Users

Legend

Desktop
Mobile
Tablet
Device Usage Trends from 2020 to 2024 (Percentage)
YearDesktopMobileTablet
202048.7%48.8%2.5%
202145.9%51.2%2.9%
202241.5%55.7%2.8%
202340.1%57.8%2.1%
202437.9%59.9%2.2%

Accessibility Issues Distribution

Pie chart showing accessibility issues distribution. 60% of users need support, 40% do not need support.
60%
NEEDS support
40%
Need Support
Cognition
Mobility
Independent Living
Hearing

Accessibility Issues Summary

  • Cognition: 13.9% affected
  • Mobility: 12.2% affected
  • Independent Living: 7.7% affected
  • Hearing: 6.2% affected

Conversion Rates by Page

0.0%
Average Rate
Food
Fashion
Electronics
Luxury
Desktop
Mobile
PageConversion Rate
Food5.8%
Fashion2.2%
Electronics1.1%
Luxury1.2%
Desktop5.1%
Mobile2.5%

Task Completion Rate

0%
Overall Success Rate

Task Completion Chart

Task completion chart showing 2 categories with overall success rate of 78%.
Task Completion Rate Chart

Chart Legend

  • Completed: 78%
  • Abandoned: 22%

Task Completion Data Table

Task completion rates by category
CategoryCompletion Rate
Completed78%
Abandoned22%

Daily Engagement Pattern

Key Engagement Metrics

6PM
Peak Hour
92%
Peak Engagement

Daily Engagement Pattern Chart

An area chart showing engagement percentages throughout the day from 12AM to 11PM. The chart shows engagement starts low at night, gradually increases during the day, peaks at 6PM with 92% engagement, then decreases towards night.
Daily engagement pattern data: 9AM: 72% engagement, 12PM: 85% engagement, 3PM: 76% engagement, 6PM: 92% engagement, 9PM: 89% engagement, 12AM: 12% engagement. Peak engagement is 92% at 6PM.

Daily Engagement Summary

  • 9AM: 72% engagement
  • 12PM: 85% engagement
  • 3PM: 76% engagement
  • 6PM: 92% engagement
  • 9PM: 89% engagement
  • 12AM: 12% engagement

Key Statistics

F-Pattern

Eyetracking visualizations show that users often read Web pages in an F-shaped pattern.

*4
PRO TIP80% of people are willing to pay more for a better user experience
0%
*5

First Click

Users decide website quality in 0.05 seconds. 50ms is all it takes for first impressions

*6

Click Rule

Users expect to find info within 3 clicks. Beyond 3 clicks, abandonment rate jumps 40%

*7

Loading Speed

1 second delay = 7% conversion loss. Page speed directly impacts user behavior

*8

Click Accuracy

44px is the optimal touch target size. Smaller targets increase error rate by 60%

*9

Cognitive Load

Users can only process 7±2 items at once. Miller's Law affects menu and list design

*10
Click to expand the data sources and references section
Disable
Animations
Disable animations